
On May 17 of 2018, an interim agreement leading to the formation of a free trade area (FTA) between the Eurasian Economic Union (EEU) and the Islamic Republic of Iran was signed within the framework of the Astana Economic Forum. The agreement was signed by Chairman of the Board of the Eurasian Economic Commission (EEC) Tigran Sargsyan, Vice-Prime Minister of Armenia Tigran Avinyan, First Deputy Prime Minister of Belarus Vasily Matyushevsky, Deputy Prime Minister of the Republic of Kazakhstan Askar Mamin, Vice-Prime Minister of the Kyrgyz Republic Zamirbek Askarov, Deputy Prime Minister of the Russian Federation Dmitry Kozak and Minister of Industry, Mines and Trade of the Islamic Republic of Iran Mohammad Shariatmadary (eurasiancommission.org-a, 2018). The document implies that there will be two stages that will lead to the creation of a free trade area. Interim agreement will function three years and it is planned to agree on a full-format agreement on FTA between the EEU and Iran. The agreement will cover almost the entire current trade commodities and it is expected that it will increase the amount of the current trade between the EEU and Iran by 150%.
According to the Ministry of Economy of Kazakhstan, this agreement will bring huge benefits to the economy of Kazakhstan facilitating the access to the Iranian market for domestic producers. The interim agreement makes it much easier to export to Iran such goods as beef and lamb, chickpeas, lentils, peas, barley, maize, vegetable oil and others. According to the ministry, there is a positive dynamics of mutual trade between Kazakhstan and Iran, which for the first quarter of 2018 grew by 70% compared to the same period in 2017, amounting to more than $170 million (informburo.kz, 2018). The signing of the agreement can be considered as a step further in the process that began long ago. Iran was interested in strengthening trade cooperation with Russia as well as with other EEU members since the very beginning of the integrational process and the free trade agreement was one of the most probable outcomes. In December of 2016, for instance, President Rouhani paid visits to Russia, Armenia, Kyrgyzstan and Kazakhstan and signed a number of documents covering issues of bilateral cooperation.
Iran is indeed a huge market with a GDP of $425 billion, which is more than three times as large as of that of Kazakhstan, and with a population exceeding 80 million people. The trade turnover between Iran and Kazakhstan has been declining over the last 3 years and was only $552.6 million in 2017. However, during the first quarter of 2018 the amount of bilateral trade has grown by 71% compared to the same period of 2017. The absolute figures of trade might sound misleading unless we compare them with trade relations with other countries. In 2017, the trade between Kazakhstan and Iran was at $552.6 million, which accounted for only 0.7% of the total foreign trade of Kazakhstan. If to take into account the GDP size of Iran, geographical proximity and the fact that the two countries share maritime traffic through the Caspian Sea, the bilateral trade amount is negligibly small. To compare with, the trade turnover between Kazakhstan and Vietnam is 542.7 million, which is almost equal to the bilateral trade with Iran. However, Iran is located much closer to Kazakhstan and its GDP is 2.25 time higher than that of Vietnam. The primary reason that explains the boosting trade with Vietnam is the free trade agreement between the EEU and Kazakhstan, which was first signed in 2015. Since then, the amount of trade between Kazakhstan and Vietnam increased 26 times. Moreover, Kazakhstan’s current account with both Vietnam and Iran is strictly positive meaning that exports exceed imports.
| Figure 1: Dominant industries in the exports of Kazakhstan to Vietnam and Iran in 2014 and 2017 | |||||
|
|||||
| 2014 | 2017 | ||||
| Code | Industry | % share | Code | Industry | % share |
| 2524 | Asbestos | 72.0 | 7901 | Zinc untreated | 46.4 |
| 9023 | Instruments, apparatus and models designed for demonstration purposes | 20.1 | 7801 | Untreated lead | 46.2 |
| 8517 | Communication equipment and parts thereof | 4.1 | 7207 | Semi-finished products of non-alloy steel | 6.1 |
| 8412 | Engines and power plants | 2.0 | |||
| 7326 | Other ferrous metal products | 1.2 | |||
|
|||||
| 2014 | 2017 | ||||
| Code | Industry | % share | Code | Industry | % share |
| 1001 | Flat rolled products of non-alloy steel, hot-rolled | 33.6 | 7209 | Flat-rolled products of non-alloy steel, cold-rolled | 30.0 |
| 1003 | Wheat | 20.4 | 1003 | Barley | 26.4 |
| 1004 | Flat-rolled products of non-alloy steel, cold-rolled | 20.3 | 7208 | Flat rolled products of non-alloy steel, hot-rolled | 25.7 |
| 1008 | Barley | 11.3 | 7225 | Flat-rolled products of alloy steel, with a width of 600 mm or more | 3.6 |
| 1204 | Semi-finished products of non-alloy steel | 8.4 | 7210 | Flat-rolled products of non-alloy steel, clad | 2.9 |
| 1205 | Flat-rolled products of non-alloy steel, clad | 1.9 | 1205 | Seeds of rapeseed | 2.2 |
| 1206 | Seeds of rapeseed | 1.2 | 2306 | Wastes from the extraction of other vegetable oils | 1.9 |
| 7207 | Semi-finished products of non-alloy steel | 1.7 | |||
| 0713 | Dried bean vegetables | 1.3 | |||
| Source: prepared by author based on data from www.eurasiancommission.org | |||||
Figure 1 a) above shows the industrial exports of Kazakhstan to Vietnam prior to signing the free trade agreement and after structure. The industries are indicated according to the Standard International Trade Classification (SITC) at four-digit level of disaggregation, which is also accepted by the Eurasian Commission (eurasiancommission.org-b, 2018). As we can observe, in 2014 the exports to Vietnam were extremely concentrated with almost three thirds of it accounting for asbestos exports. After a tremendous growth of exports in 2015 and 2016, we can see that in 2017 the structure of the exports did not change very much in terms of proportions. In both cases, few industries accounted for over 95% of the total exports of Kazakhstan to Vietnam. The same can be said about Iran if we look at Figure 1 b). Thus, in 2014, only seven commodity categories made more than 97% of the total exports to Iran and the same is true for 2017. In other words, despite of huge differences in the amount of exports of Kazakhstan to Vietnam and Iran, the sectorial structure of exports did not change and only few industries accounted for more than 95% of them.
The difference of export growth to Vietnam and Iran can be seen contrasting the Figures 2 a) and b) below. The red line is the Herfindahl-Hirschman Index (Herfindahl, 1950; Hirschman, 1964) that shows the degree of industrial concentration of exports. It is interesting to note that the boosting exports of Kazakhstan to Vietnam during 2016-2017 did not contribute to the diversity of exports. Moreover, we can’t see any strong correlation between the diversity of exports between 2011 and 2017 neither in case of Vietnam nor in that of Iran.
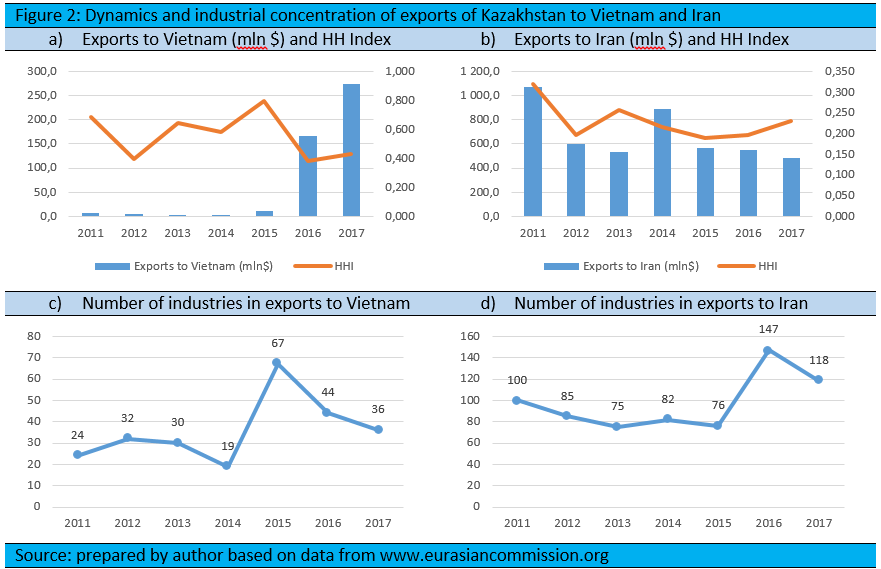
The signing of an interim agreement leading to the formation of an FTA between the EEU and Iran is one more step in strengthening the bilateral economic cooperation that will bring significant trade benefits to all participating countries. Currently, Iran is one of the countries that Kazakhstan under trades with, if to take into account the geographical proximity between the two countries and their GDP sizes. The case of Vietnam shows that trade liberalization leads to huge increase of bilateral trade and of the exports from Kazakhstan in particular. However, based on the analysis of trade with Vietnam, we state that the growth of trade does not necessarily help to reach the primary objective of Kazakhstan, which is export diversification. Basically, the growth of exports to Vietnam since 2015 only changed the scale increasing the quantities exported of the same commodities not changing them in terms of quality. Apart from being limited in number, the industries that are involved in exports to both countries are mainly industries with relatively low value added capacity. In this regard, from the policymaking point of view it would be helpful to take supportive measures that would comply the current regulation in the EEU, favoring the industries that have small shares in export flows.On the other hand, the Figures 2 c) and d) reveal a sudden increase of the number of exported commodity types to Vietnam and Iran in 2015 and 2016 respectively. The growing number of industries involved in the exports to Vietnam after 2015 can be related to the growth of the overall amount of exports. However, we can observe the same pattern in case of Iran in 2016 and 2017 when there was an overall decrease of the exports of Kazakhstan to Iran. It is even more contradictive these data to the Figures 1 a) and b). It turns out that the number of industries involved in exports from Kazakhstan to Vietnam and Iran where not related the overall volume of exports and did not even change the degree of diversity of the export structure. In order to find the real causes of this discrepancy we have calculated the share of industries that appeared newly in 2016 in the exports to Vietnam and Iran and where absent in 2014. We have found that the share of new industries in the total exports to Vietnam and Iran in 2016 where only 0.6% and 1.9% respectively. From this, we can state that, firstly, skyrocketing exports to Vietnam did not make it more divers and a small number of more or less the same industries accounted for over 95% of the exports. Secondly, even growth of the number of industries present in the exports did not lead to higher export diversification in both cases. The share of the industries that newly appeared in the export flows both to Vietnam and to Iran in 2016 were negligibly small. Thirdly, the growth of the number of industries in the export flows from Kazakhstan in 2015-2016 was not a result of the free trade agreement. We can deduce it from the fact that in 2016 there was a growth of the number of industries involved in exports to Vietnam and Iran despite the fact that the latter did not have valid free trade agreement with Kazakhstan at that time. One of the possible reasons for that, however, can be the sudden depreciation of tenge that occurred in the second half of 2015.
References
Eurasiancommission.org-a, (2018): “The Interim Agreement, leading to the formation of a free trade area between the EEU and Iran” retrieved from: http://www.eurasiancommission.org/ru/nae/news/Pages/17-05-2018-1.aspx, accessed on 14.05.2018.
Eurasiancommission.org-b, (2018): External trade data by countries data retrieved from: http://www.eurasiancommission.org/ru/act/integr_i_makroec/dep_stat/tradestat/tables/extra/Pages/default.aspx, accessed on 16.05.2018.
Herfindahl, O.C. (1950): “Concentration in the Steel Industry,” unpublished Ph.D. thesis, Columbia University, 1950, Ch. 2, p. 47-48.
Hirschman, O.A. (1964): “The Paternity of an Index,” The American Economic Review, Vol. 54, No. 1, (September, 1964), p. 761-762.
Informburo.kz (2018): “In Astana, the EEA and Iran signed an agreement on the creation of a free trade zone” retrieved from: https://informburo.kz/novosti/v-astane-eaes-i-iran-podpisali-soglashenie-o-sozdanii-zony-svobodnoy-torgovli.html accessed on 19.05.2018.
Note: The views expressed in this blog are the author’s own and do not necessarily reflect the Institute’s editorial policy.