
According to the most recent data from the Committee on Statistics of the Ministry of National Economy of Kazakhstan, the internal migrants in 2018 amounted to 91,347 people, which is the second highest number of internal migrants registered within a year since 2000, the first being in 2016 when 106,518 people migrated from one region of the country to another. Thus, compared to 2017, the number of internal migrants in 2018 increased by 37.5%. However, before making analysis this figure should be adjusted due to administrative changes in the territorial structure of the country that were made in 2018. In particular, on June 19 of 2018 the South Kazakhstan regions was reorganized into two administrative territorial units of Turkistan region and the city of Shymkent and 2018 is the first year when these two territorial units appear separately [Akorda, 2018].

Figure 1 shows the change of the number of internal migrants since 2000 on a yearly basis. As we can see, the number of internal migrants in Kazakhstan in general terms can be considered as low. During 2000-2018 it were below 1.0% of the total population. However, there were considerable changes of the number of internal migrants throughout this period. After a sharp descend in 2001-2002 it stayed relatively stable during 2002-2015 between 0.3 and 0.5%. Then in 2016, we can see a doubling of the number of migrants. Here it should be noted that this does not mean that there was a corresponding increase of the number of internal migrants, although we still admit that there might have been a considerable increase. The dramatic augmentation of the number of the percentage of internal migrants in 2016 was due to the fact that on December 22 of 2016 the head of state signed the law “On introducing amendments and addenda to some legislative acts of the Republic of Kazakhstan on countering extremism and terrorism” (Zakon.kz). The law entered into force starting from January 1 of 2017 and made it obligatory for citizens to register at the place of residence. Hence, nearly half of the internal migrants that were not in the statistical data before became “visible” in internal migration data records
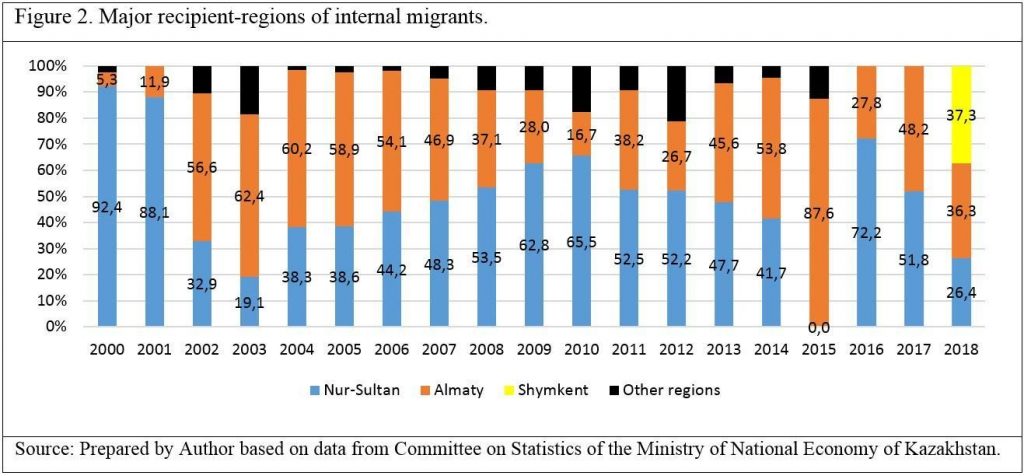
If we look at the vectors of internal migration, it is not surprising to find out that that major cities like Almaty and Nur-Sultan are the main points of attraction of internal migrants. Figure 2, shows the main regions of destination of internal migrants. Thus, in 2016 and 2017 for instance, these two cities were the only two regions of the country that experienced net inflow of internal migrants. On average, the two largest cities of Kazakhstan receive 20-30 thousand internal migrants every year. Other regions predominantly lose their population when it comes to internal migration and partially or totally replace them by natural movement of population. Regions adjacent to the cities of Almaty and Nur-Sultan like Almaty and Akmola region as well as western oil-producing region occasionally become net recipients of internal migrants.
Starting from 2018, we can see a separate statistics for the city of Shymkent and it is interesting to note that having a population of nearly 1 million people, Shymkent is one of the most attractive destinations for internal migrants. Thus, in 2018, Shymkent ranked the first in terms of net internal migration attracting 34,094 people from other regions and accounting 37.3% of the total number of internal migrants of the country. This change in the statistical records of the Committee on Statistics also distorted the Figure 1, exaggerating the number of internal migrants for 2018. If the city of Shymkent were not separated from the South Kazakhstan region, the total number of internal migrants in 2018 would be 57,253, which would mean a slight decrease since 2017. However, in terms of statistical data record, the exclusion of the city of Shymkent from its adjacent region is a positive factor that allows to make more accurate analysis.
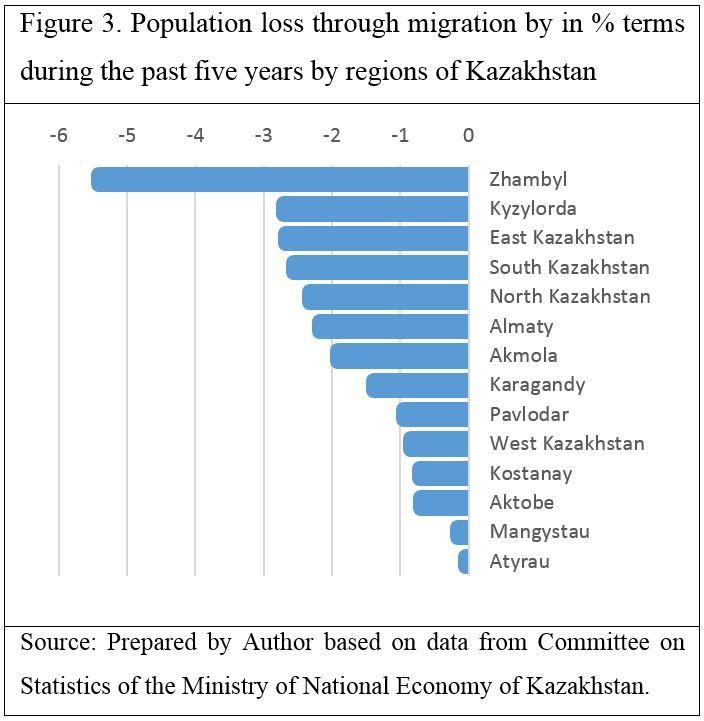
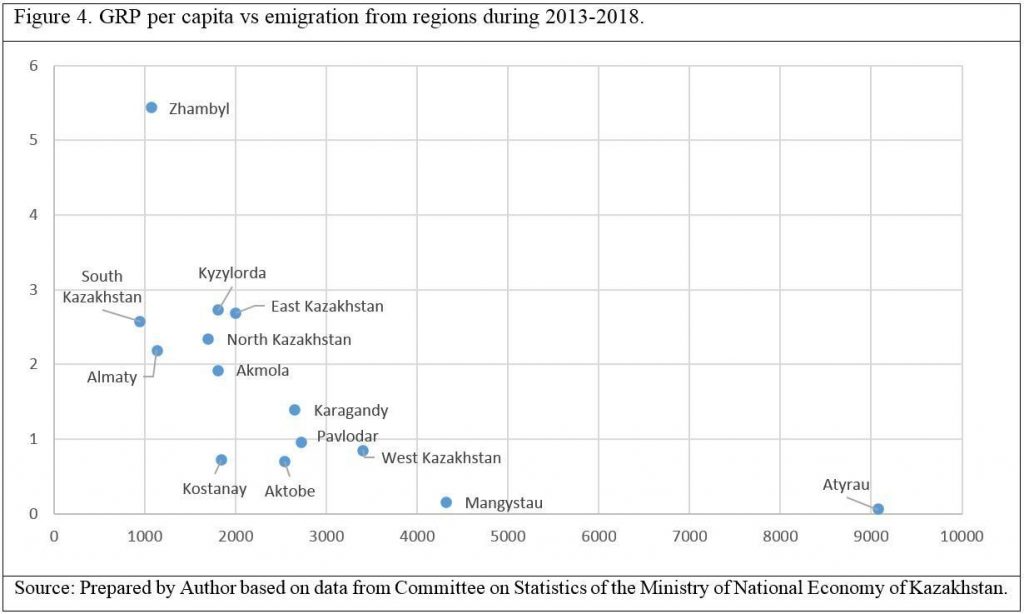
In order to see which regions lose the most in terms of internal migration of population we plot Figure 3, where can observe the number of internal net migrants calculated as the sum of net migrants during the past five years as percentage of the average population of the region during the past five years. As we can see, all southern regions and well as extreme northern and extreme eastern parts of the region demonstrate the highest levels of net internal emigration. On the other hand, the two leading western oil-producing regions have the least number of net internal emigrants. One of the straightforward explanations for such drastic differences of the number of internal migrants is the level of wealth. Thus, plotting the GRP per capita, which is one of the most basic indicators of regional wealth, against the percentage of net emigrants we get a rather accurate negative relationship between these two parameters (See Figure 4). Obviously, relative wealth and well-being of households is one of the factors determining the internal migration and the population tends to flee from poorer regions to wealthier regions.
One of the factors that should be taken into account in analyzing the internal migration is the process of urbanization. The process of internal migration can be decomposed into several factors, including urbanization. Without any doubt urbanization is one of the important variables that shape the internal migration in Kazakhstan and our finding are completely in line with this statement. For instance, the analysis of data has shown that the largest urban areas such as the cities of Nur-Sultan, Almaty and Shymkent are the major recipients of internal migrants. Moreover, the new statistical data for the city of Shymkent, which is in fact far behind the other two major metropolitan areas in terms of wealth, reveals that the effect of urbanization in determining the internal migration can be very significant.
The fact that Shymkent turns out to be one of the major points of attraction along with Almaty and Nur-Sultan can be decomposed into two factors. Firstly, being one of the major urban areas itself generates centripetal forces attracting internal migrants that seek better jobs, amenities, opportunities for studying etc. On the other hand, the case of Shymkent can also be explained by the fact that the surrounding region of Turkistan has the highest population density with numerous small settlements closely connected with the city. Hence, Shymkent simply has greater number of people living around the city and willing to move to the nearest major city than do Almaty or Nur-Sultan. When these people decide to move to a big city they simply minimize their costs of transportation and relocation and opt for Shymkent, which is nearest major urban area. Finally, wealth of the regions is one of the primary factors that explain internal migration patterns in Kazakhstan. There is a clear negative relationship between GRP per capita and the number of net emigrants from the regions suggesting that more people tend to abandon relatively poorer regions and move to big cities or other relatively wealthier regions.
References
Akorda (2018). On some issues of the administrative-territorial structure of the Republic of Kazakhstan. Retrieved from http://www.akorda.kz/ru/legal_acts/decrees/o-nekotoryh-voprosah-administrativno-territorialnogo-ustroistva-respubliki-kazahstan. Accessed on 08.07.2019.
Zakon.kz (2019). Temporary registration in Kazakhstan. Retrieved from https://www.zakon.kz/s/vremennaja-registracija-v-kazakhstane/. Accessed on 08.07.2019.
National Census (2009). Migration of the Population. Retrieved from http://old.stat.gov.kz/faces/wcnav_externalId/perepis?_afrLoop=13961130608049984#%40%3F_afrLoop%3D13961130608049984%26_adf.ctrl-state%3Dr2tal22fa_51. Accessed on 03.07.2019.
Committee on Statistics of the Ministry of National Economy of Kazakhstan (2019). The official statistical information, Operational data, Population. Retrieved from http://old.stat.gov.kz/faces/wcnav_externalId/homeNumbersPopulation?_afrLoop=13962071764466278#%40%3F_afrLoop%3D13962071764466278%26_adf.ctrl-state%3Dr2tal22fa_106. Accessed on 01.07.2019.
Committee on Statistics of the Ministry of National Economy of Kazakhstan (2019). Official statistical information, Operational data, National accounts. Retrieved from http://old.stat.gov.kz/faces/wcnav_externalId/homeNationalAccountIntegrated?_afrLoop=13962229303886951#%40%3F_afrLoop%3D13962229303886951%26_adf.ctrl-state%3Dr2tal22fa_140. Accessed on 01.07.2019.
Note: The views expressed in this blog are the author’s own and do not necessarily reflect the Institute’s editorial policy.