The abundance of natural resources, such as oil and gas, plays a substantial role in economic development. Some resource-abundant countries achieved significant progress in human capital development, while others remain on the list of least developed economies. In fact, differences in economic development between Norway and Venezuela are significant.
Taking into consideration different paths and development models of oil economies, it is important to analyze the case of Azerbaijan as one of the most resource-abundant post-Soviet countries. Like all post-Soviet states, Azerbaijan experienced a reduction in production indicators, high levels of inflation and unemployment and the disruption of the Soviet supply chains. Furthermore, besides the economic downturn, Azerbaijan had political and military shocks. Figure 1 shows the dynamics of the country’s gross domestic product (GDP) per capita.
Figure 1. GDP per capita of Azerbaijan, current USD
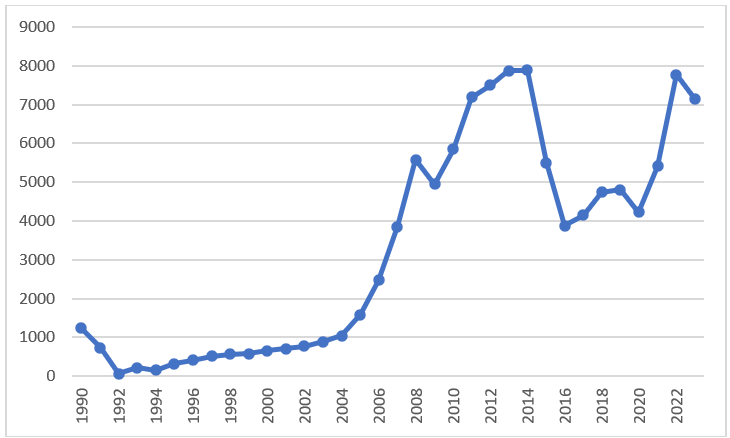
Source: The Author’s compilation using World Bank (2024) data.
In the 1990s, growth in the indicator was insignificant. In the early 2000s, the indicator started to grow faster, while in the mid-2000s, Azerbaijan’s GDP per capita surged and peaked in 2014 reaching almost 7,900 USD. In 2023, the indicator amounted to 7,155 USD, increasing by nearly 11 times compared with the level of 2000. However, the country experienced a substantial reduction in GDP per capita in 2016 following the drop in oil prices. Compared to the maximum level, the 2016 indicator declined by almost 51%. This fact shows the high vulnerability of Azerbaijan’s economy to external shocks such as price reductions. The growth of resource prices in 2022 contributed to the increase in GDP per capita. Despite this increase, in 2023 Azerbaijan’s indicator was lower than the GDP per capita of resource-rich Kazakhstan (13,136 USD) and its neighboring Georgia (8,120 USD).
Azerbaijan achieved progress in GDP per capita growth by attracting investments from international oil companies (IOC) and solving transportation issues. IOC investments allowed Azerbaijan to discover new oil and gas fields and increase their production volumes. The construction of new oil and gas pipelines helped Azerbaijan to increase transportation capacities. In particular, Azerbaijan reached agreements with Russia and Georgia to transport its oil using Baku-Novorossiysk and Baku-Supsa pipelines. At the same time, the country started construction of strategic pipelines such as Baku-Tbilisi-Ceyhan and Baku-Tbilisi-Erzurum.
According to the State Statistical Committee of the Republic of Azerbaijan (2024), in 1995, the length of Azerbaijan’s pipelines amounted to 3,678 km, which increased to 5,772 km in 2023. For the reported period, the lengths of oil pipelines changed from 712 km to km, and gas pipelines – from 2,966 km to 4,184. The length of oil pipelines reached 1,168 km in 1999, and 1,610 km in 2006 due to the launch of the Baku-Supsa and Baku-Tbilisi-Ceyhan pipelines. The launch of the pipelines contributed to the surge of oil and gas transportation to Türkiye and European markets. Oil transportation increased from 8,846 thousand tons in 1996 to 11,774 thousand tons in 2000. In 2006, the indicator amounted to 19,947 thousand tons and surged to 39,999 thousand tons in 2007. Transportation through oil pipelines peaked in 2009 reaching 50,480 thousand tons. In 2023, Azerbaijan transported through pipelines 39,753 thousand tons of oil. It is worth mentioning that in the period 2009-2020, Azerbaijan’s oil supplies had a decreasing trend. Contrary, transportation of natural gas using pipelines shows a steady growth, increasing from 3,502 thousand tons in 1996 to 28,284 thousand tons in 2023. Thus, during the reported period, while transportation of oil increased by 4.5 times, the growth for natural gas was 8.1 times. Hence, demand for Azerbaijan’s natural gas is higher. The European Union’s willingness to reduce dependence on Russian natural gas is one of the reasons for this tremendous growth. According to O’Byrne (2024), in July 2022, Azerbaijan announced its plans to double exports of natural gas to Europe to 20 bcm per year by the end of 2027.
This requires growth in exports by over 50 percent in three years. Despite the higher output of natural gas with new production wells, Azerbaijan cannot confirm whether the increased production will be enough to meet Baku’s commitments to the EU, growing domestic consumption and rising demand in Türkiye and Georgia. Moreover, Baku will still have to increase the capacity of the pipelines carrying gas to Europe (O’Byrne, 2024). Politico (2024) reports that since the conflict in Ukraine, the EU has been strengthening its energy ties with Azerbaijan. The EU politicians expect that Azerbaijan will run its gas through a pipeline that currently brings Russian fuel to the EU via Ukraine when a transit deal between Kyiv and Moscow expires at the end of 2024.
However, a key factor, explaining the decrease in oil transportation is the substantial decline of oil extraction in Azerbaijan (Figure 2). In 2010, crude oil extraction peaked and amounted to 50,838 thousand tons. In the following period, oil extraction started to decrease and reached 30,147 thousand tons in 2023. Hence, in 2023, the indicator decreased by almost 41% compared to its peak level. Interfax (2024) reports that during January-September 2024 production and exports of oil correspondingly decreased by 4.8% and 5.8% year-on-year.
Reduction of oil production is another important risk and challenge for Azerbaijan’s economy. Despite the country’s efforts to resume the volume of production, the output retains the decreasing trend. Ibadoghlu (2024) mentions that the reduction in oil production, the increase in operational and transportation costs, and lower global market prices cause a reduction in oil and gas revenues in Azerbaijan.
In turn, during the same period, production of natural gas increased from 26,312 to 48,497 million cubic meters, surging by high 84.3%. Hence, revenues from natural gas exports can be considered compensation for oil revenue losses.
Figure 2. Crude oil (including gas condensate) extraction (thousand tons) and production of natural gas (million cubic meters) in Azerbaijan
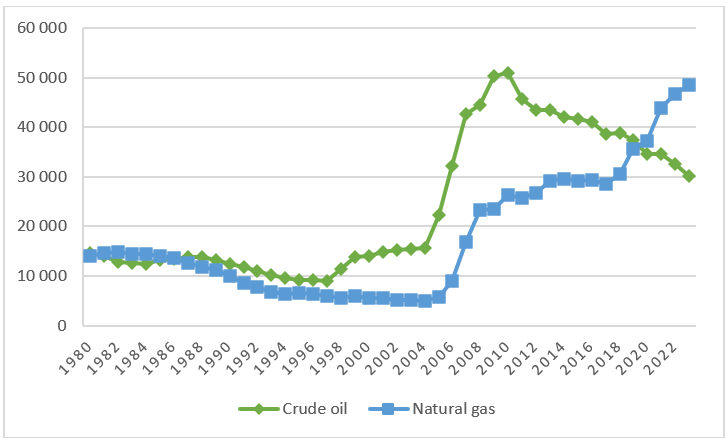
Source: Author’s compilation using data from the State Statistical Committee of the Republic of Azerbaijan (2024).
Azerbaijan’s foreign trade shows significant growth. The country’s total trade increased from 4 billion USD in 1991 to almost 51.2 billion USD in 2023. In the same period, Azerbaijan’s exports and imports grew by 16 and 9 times, respectively. The trade balance changed from 0.2 to 16.6 billion USD. The oil and gas boom made Azerbaijan’s economy extremely dependent on fuel exports. Figure 3 shows that the share of mineral fuels in the country’s total exports increased from 82% in 2004 to 91% in 2023.
Figure 3. Share of mineral fuels in total exports, %
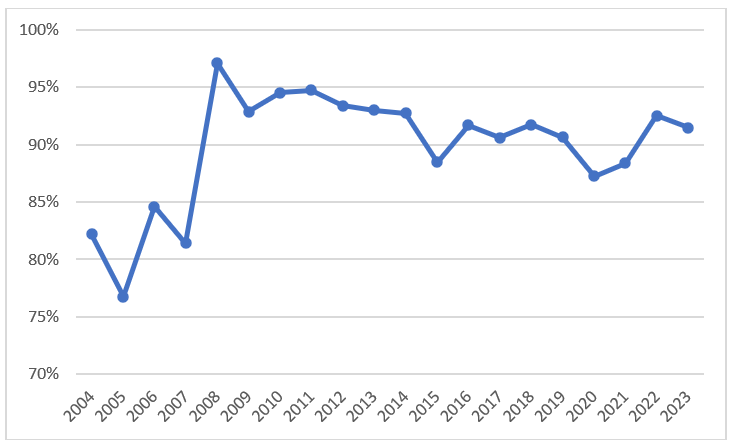
Source: The Author’s calculations are based on ITC (2024) data.
It is worth mentioning that in 2008 the share amounted to 97%. Besides mineral fuels, in 2023, the top five export products of Azerbaijan included edible fruit and nuts, plastics, edible vegetables and aluminum. In the same year, a share of edible fruit and nuts in Azerbaijan’s total exports amounted to 1.5% (0.9% in 2004), plastics – 1.4% (1.9% in 2004), vegetables – 0.6% (0.3% in 2004), and aluminum – 0.6% (1.4% in 2004). Other indicators, demonstrating Azerbaijan’s dependence on natural resources, are oil rents and total natural resources rents. According to the World Bank (2024) data, oil rents (as % of GDP) decreased from 33% in 2000 to 21% in 2021. During the same period, total natural resources rents (as % of GDP) declined from 35% to 30%. Despite this reduction, the indicators remain high.
The annual GDP growth of Azerbaijan shows the vulnerability of its economy to price and output shocks (Figure 4). Increasing supplies of mineral fuels resulted in higher growth rates. In 2006, Azerbaijan reached a record level of GDP growth, which amounted to 35%. Simultaneous increases in the volumes of exports and world oil and natural gas prices caused this record growth. For instance, actual prices as a percent of the previous year for Azerbaijan’s exports amounted to 147% in 2006, while in 2008 it surged to a record 788%. Since 2010, the country’s economy has experienced a slowdown. In general, the average annual growth rate of Azerbaijan’s GDP increased from minus 6% in 1991-1999 to a high of 16% during 2000-2009. Between 2010 and 2019, the average growth rate decreased to 2%.
Figure 4. GDP growth rate, annual %
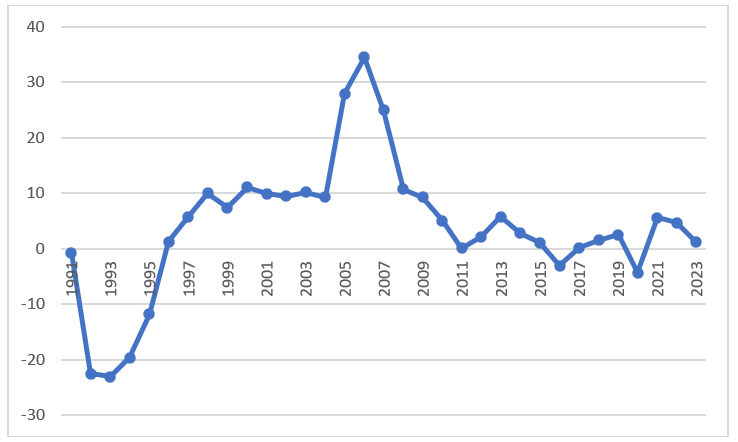
Source: The Author’s compilation using World Bank (2024) data.
Thus, Azerbaijan demonstrates a high dependence on mineral fuels and the country needs to transform its economy to ensure sustainable growth and development and mitigate the potential impact of negative external shocks. These shocks include price volatility, lower levels of production, and lower demand by main trade partners. It is worth mentioning that climate change-driven policy transformations, especially in the main importer of Azerbaijan’s mineral fuels, the European Union, also pose additional risks. Hence, Azerbaijan needs to strengthen its human capital by supporting and investing in education, healthcare and science. It is worth mentioning that Azerbaijan attained positive changes in the Human Development Index (HDI), which shows progress in terms of a long and healthy life, access to knowledge and a decent standard of living. Between 1995 and 2022, Azerbaijan’s HDI value changed from 0.6 to 0.76, which put the country in the High human development category (UNDP, 2024). However, Azerbaijan’s support of science remains limited. Data from the State Statistical Committee of the Republic of Azerbaijan (2024) shows that despite the number of researchers increasing from 15.8 thousand in 2000 to 19.9 thousand in 2022, financing of science from the state budget decreased from 0.2% to 0.13% of GDP during the reported period. Moreover, financing of science in percent to expenditures of the state budget also declined from 1.2% to 0.52%. Hence, Azerbaijan should increase support of science and focus on research and development as human capital will serve as a basis for future economic diversification projects. Furthermore, besides investing in human capital, it is important to accumulate physical capital and develop the country’s infrastructure. Human and physical capital investments will improve Azerbaijan’s competitiveness.
Thus, Azerbaijan needs to use temporary revenues from mineral resources to attain a competitive economy with highly developed human capital.
References:
Ibadoghlu, Gubad (2024). Three Key Factors Reducing Oil Revenues in Azerbaijan. Retrieved from https://ssrn.com/abstract=4920430. Accessed on 15.10.2024.
Interfax (2024). Azerbaijan reduced oil production 4.8%, exports 5.8% in 9M – ministry. Retrieved from https://interfax.com/newsroom/top-stories/106590/#:~:text=2024%2013%3A24-,Azerbaijan%20reduced%20oil%20production%204.8%25%2C%20exports%205.8%25%20in%209M,data%20from%20the%20Energy%20Ministry. Accessed on 15.10.2024.
International Trade Center (2024). Trade map. Azerbaijan. Retrieved from https://www.trademap.org/Index.aspx. Accessed on 14.11.2024.
O’Byrne, David (2024). Azerbaijan’s gas exports increased, but Baku is still challenged to meet EU goals. Retrieved from https://eurasianet.org/azerbaijans-gas-exports-increase-but-baku-still-challenged-to-meet-eu-goal. Accessed on 01.09.2024.
Politico (2024). EU wants Azerbaijan to fuel the Russian gas pipeline in Ukraine. Retrieved from https://www.politico.eu/article/eu-asks-azerbaijan-replace-russian-gas-transit-deal-ukraine-expiring/. Accessed on 10.09.2024.
State Statistical Committee of the Republic of Azerbaijan (2024). Energy, Trade, Transport and Price sections. Retrieved from https://www.stat.gov.az/?lang=en. Accessed on 10.11.2024.
United Nations Development Program (2024). Human Development Reports. Azerbaijan. Retrieved from https://hdr.undp.org/data-center/specific-country-data#/countries/AZE. Accessed on 04.11.2024.
World Bank (2024). World Bank Open Data. Azerbaijan. Retrieved from https://data.worldbank.org/country/azerbaijan. Accessed on 14.11.2024.
Note: The views expressed in this blog are the author’s own and do not necessarily reflect the Institute’s editorial policy.