International trade has been and remains one of the most important factors impacting on the basic growth indicators. Many studies show that relations between trade and economic growth are positive and strong. Frankel and Romer (1999) indicate that both within-country and international trade raise income by accumulation of physical and human capital and by increasing output for given levels of capital. Singh (2010) in his survey article provides a dominant support for the positive and significant effects of trade on output and growth. Therefore, the purpose of the commentary is twofold. Firstly, it analyzes dynamics of economic growth in the region. Secondly, it aims to determine basic factors, which affected regional growth with focus on trade, in particular export. In doing so, it focuses on two groups of products, identified as minerals (chapters 26-27 of the HS codes) and metals (chapters 71-83). These groups were chosen in order to analyze a success of diversification, which is the priority for all regional economies since independence.
Three decades of independence tell three different stories about economic growth in Central Asia. During the first decade of independence the region disintegrated, output plummeted, hyperinflation occurred and living standards decreased substantially. In this period all countries experienced negative growth rates which varied from the highest -0.5% in Uzbekistan to the lowest -10.2% in Tajikistan (Figure 1). The second decade coincided with the energy super-cycle and significantly transformed the region. Economies grew fast due to minerals export and investment attracted to the resource sector. Average growth rates varied from the lowest 4.5% for Kyrgyzstan to the highest 8.6% for Kazakhstan. High growth rates continued until the global financial crisis. The third decade started with recovery. According to the Macrotrends (2020) data, oil prices, which decreased from $164 per barrel in June 2008 to $51 in January 2009, in the following years started to increase and reached $130 in April 2011. In general, since December 2010 average prices were higher than $100 until September 2014. In January 2016, they dropped to $36, which led the region into recession.
Minerals and metals exports played the key role in all these changes. Dynamics of their exports are calculated using data from the International Trade Centre (ITC, 2020) and summarized in the following Figures 2-3. It should be noted that data for Tajikistan is available only for 2014-2018, and for Uzbekistan for 2017-2018.
Figure 1. Average economic growth in Central Asia, %
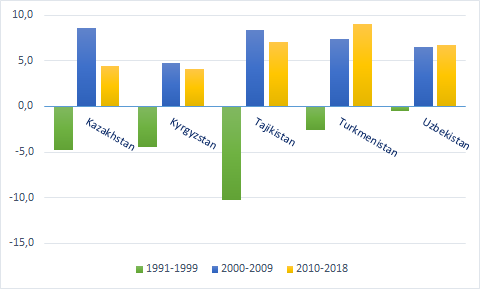
Source: The Author’s calculations based on the World Bank (2020) data.
Figure 2. Share of minerals in total exports, %
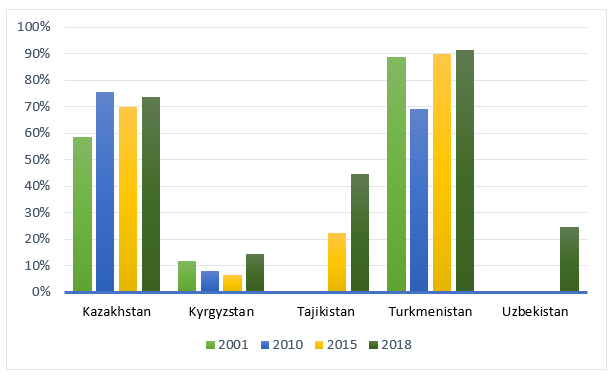
Source: The Author’s calculations based on the ITC (2020) data.
As Figure 2 shows, mineral exports became dominant for the majority of Central Asian states. For Kazakhstan, this share increased from 59% in 2001 to 74% in 2018, while the indicator of Kyrgyzstan changed from 12% to 14% for the same period. In Kyrgyzstan, this share had a decreasing trend for 2010 and 2015. Changes for Tajikistan are significant. It can be explained by increasing export of ores, slag and ash. In 2018, the exports of the ores were 5 times higher than of mineral fuels. The indicator for Turkmenistan varies between 89-91%, except for the crisis period. Minerals started to play an important role for Uzbekistan as their share increased from 16% in 2017 to 25% in 2018.
Figure 3. Share of metals in total exports, %
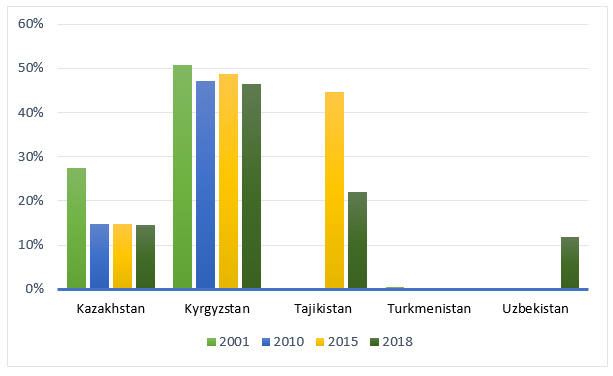
Source: The Author’s calculations based on the ITC (2020) data.
As Figure 3 demonstrates, the role of metals in Kazakhstan’s export declined. If in 2001 it equaled 27%, for the rest of the period varied between 14-15%. The metals export is important for Kyrgyzstan, the share of which also decreased, but insignificantly. The Kumtor gold mine remains one of the most important contributors to the country’s GDP. For Tajikistan metal exports is vital and mainly consists of aluminum. In 2015, the share of metals was equal to 45%. However, in 2018 this share decreased to 22%. This fact can be explained by radical changes of gold exports, which during 2014-2016 period varied between $81-167 million, and then dropped to zero. However, according to Avesta (2019) informational agency, in 9 months of 2019 export of precious and semi-precious metals was 94.8 times higher compared with the same period of 2018. The value of the export equaled $125 million. This means that Tajikistan recovered its gold export and the share of metals for 2019 will be close to the results of 2015. In sum, the share of minerals and metals will be up to 90% of its exports. For Uzbekistan, metals export is becoming important and increased from 11% in 2017 to 12% in 2018.
The analysis above shows that during the three decades of independence, despite conducted diversification programs, the role of minerals and metals became more important in the regional economies. The recent evidence is the case of Tajikistan, where resource-dependence started to increase. It can be considered that recent opening policy can lead to more investment in minerals and metals in Uzbekistan, which will change the structure of economy and trade. The rise of resources according to the Dutch disease theory leads to reduction of agriculture and manufacturing with significant impact on capital and labor markets and international trade. The situation in Kazakhstan and Turkmenistan requires radical economic reforms and mainly dependent on political will. Resource and mineral dependence of Kyrgyzstan is lower, however, remains high.
There are other factors, including political ones, which influenced the growth outcomes. These include the civil war in Tajikistan and political turmoil in 2005 and 2010 in Kyrgyzstan. The second revolution in Kyrgyzstan was followed by ethnic conflict in the southern part of the country, which also became a negative shock for the growth indicators. Trade-related economic factors include the Eurasian Economic Union (EAEU), which was originally created as the Customs Union in 2010 by Belarus, Kazakhstan and Russia. In 2012, this organization evolved into Common Economic Space and transformed into the EAEU in 2015 with two additional members such as Armenia and Kyrgyzstan. It is well known that any regional integration processes lead to trade/investment creation/diversion, which should be assessed using quantitative methods. Despite its intention for free movement of goods, capital and labor, the fundamental problems such as protectionism remain. The EAEU also characterizes by the weak institutional governance, which can be viewed as a trade barrier. As integration deepens, members are more likely to become vulnerable to common shocks. The impact of Russia on the region was high historically, and integration made it more important through trade and investment channels. Thus, drop in oil prices, Ukrainian political and economic crises that led to sanctions on Russia exacerbated the regional decline. It should be noted that all attempts to create an economic organization in Central Asia led to shallow integration as countries pursued different economic and trade policies.
It is understandable that the entire region needs economic diversification. Resource-based economic policies that were strengths of Central Asia transformed in its weaknesses and created challenges, which will significantly affect Central Asia in near future. These include the end of energy super-cycle, climate and regulation-led energy market transformations, continuing stagnation of the basic trading partners, low level of physical and human capital, and brain drain. Thus, export-led growth based on minerals and metals made the entire region vulnerable and the future of growth uncertain. However, the problem for Central Asian countries is not only about resource dependence. The far important issue is distribution of resource revenues. Fair distribution can find solutions in every challenge, provided above. This point should be put back at the center of economic policy.
References:
Avesta (2019). Tajikistan has almost 100 times increased its export of precious stones and metals. Available at http://avesta.tj/2019/11/08/tadzhikistan-pochti-stokratno-uvelichil-eksport-dragotsennyh-kamnej-i-metallov/. Accessed 29.01.2020.
Frankel, Jeffrey and David Romer (1999). Does Trade Cause Growth? American Economic Review 89 (3): 379-399.
ITC (2020). Trade Map – International Trade Statistics. Available at https://www.trademap.org/tradestat/Product_SelProduct_TS.aspx?nvpm=1%7c%7c%7c%7c%7cTOTAL%7c%7c%7c2%7c1%7c1%7c2%7c2%7c1%7c1%7c1%7c1. Accessed 29.01.2020.
Macrotrends (2020). Crude Oil Prices – 70 Year Historical Chart. Available at https://www.macrotrends.net/1369/crude-oil-price-history-chart. Accessed 29.01.2020.
Singh, Tarlok (2010). Does International Trade Cause Economic Growth? A Survey. The World Economy 33 (11): 1517-1564.
World Bank (2020). GDP growth, annual. Available at http://api.worldbank.org/v2/en/indicator/NY.GDP.MKTP.KD.ZG?downloadformat=excel. Accessed 27.01.2020.
Note: The views expressed in this blog are the author’s own and do not necessarily reflect the Institute’s editorial policy.